
Proposal: Frame profiler
Milestone: Gameplay toolkit (G10) · Status: ⬜ planned ·
Depends on: Dev overlay (F12 panels), M10 editor (editor link, bottom dock) ·
Related: Post-processing (stages), Shadow system,
GPU resources, Testing (allocation gate, benchmarks), Forest
(--benchmark), Keyframe animation (G1.6) and 2D content (G2a.3): bottom dock
tabs, Rendering backend abstraction (M11: timestamps behind IGpuDevice)
Problem
Section titled “Problem”The engine measures a frame as a few totals and four hand-timed GPU passes. There is no scope API, no per-frame
history, no frame graph, no trace export and no editor view. Finding a hitch means adding Stopwatch code or temporary
timestamps, measuring, and deleting them again.
What exists:
- Frame totals.
Engine.LastFrameCpuMilliseconds(MainframeEngine/Src/Core/Engine.cs:215, computed at:585-588) is update + render without the GPU/swapchain wait,IVulkanContext.LastFrameWaitMilliseconds(MainframeEngine/Src/Rendering/Vulkan/IVulkanContext.cs:48) is that wait (fence and acquire timed inVulkanRenderer.cs:236-250). The dev overlay’s Frame panel shows FPS and average/min/max ms over its 0.25 s refresh window (MainframeEngine/Src/Debugging/DevOverlay/DevOverlayStats.cs:26-68,DevOverlayPanels.cs:35-60). There is no history: a one-frame spike only moves “max” for a quarter of a second. - CPU split.
SceneTree.ProcessSecondsandPhysicsProcessSeconds(MainframeEngine/Src/Scene/SceneTree.cs:140,:143, measured at:338-367) exist, but nothing in the repository reads them. Other CPU timings are ad hocStopwatchcalls:ShadowSystem.LastCpuMilliseconds(MainframeEngine/Src/Rendering/Shadows/ShadowSystem.cs:343,:543),Trees/TreeClusterBaker.cs:95,Trees/TreeMesh.cs:58. - GPU timing, four copies. Each timed pass owns a timestamp pool of two queries per frame slot and the same
read-when-the-slot-comes-round logic:
ShadowSystem.cs:160-212(maskstimestampValidBits),Post/SsaoEffect.cs:212-250(maskulong.MaxValue),Post/AutoExposure.cs:227-263andPost/VolumetricFog.cs:405-440(no mask).RenderServerre-exposes three of them (MainframeEngine/Src/Servers/RenderServer.cs:99-107). The prepass, the main pass, offscreen passes, TAA, glow, the tonemap and the UI have no timing. The design docs quote numbers taken with temporary timestamps (post-processing.md:190, editor.md:793, color-pipeline.md:392-396), and the last one notes that MoltenVK samples timestamps at encoder boundaries. - The frame to instrument.
Engine.RenderFramerunsPrepareFrame,BeginFrame, shadows, offscreen, prepass, main andEndFrame(Engine.cs:549-580). Uploads are recorded first in the command buffer (VulkanRenderer.cs:282). Every post effect is recorded by one loop (Post/PostProcessStack.cs:94-116,effect.Recordat:109). The overlay pass runs the UI’s offscreen work,BeforeTonemap, the tonemap,AfterTonemapand the overlay renderers (VulkanRenderer.Presentation.cs:819-938;:839,:857,:929). - Counters.
MeshDrawStats(Rendering/Meshes/MeshRenderer.cs:8-45) counts draws, instances, culled and binds, but not triangles. The canvas counts draws (Rendering/Canvas/VulkanCanvasRenderer.cs:140).GpuAllocator.Totalsis an O(1) counter (Rendering/Vulkan/Memory/GpuAllocator.cs:20-21,:238). The physics spaces measure their libraries’ allocations (Physics/3D/PhysicsSpace3D.cs:702-704,Physics/2D/PhysicsSpace2D.cs:757-759). All of these are point values read at 4 Hz by the overlay. - Debug labels.
VK_EXT_debug_utilsis enabled only with validation, for the messenger (VulkanRenderer.cs:596,:638-646). Command buffers have no labels, so RenderDoc and Xcode captures show unnamed passes. - Offline numbers.
ForestBenchmarkkeeps its own per-frame arrays and polls the four GPU properties (Examples/Forest/Forest/Src/Dev/ForestBenchmark.cs:27-35,:100-117). The render-test host records frame and shadow times (Tests/MainframeEngine.RenderTests.Host/HostResult.cs:64-87).just benchruns BenchmarkDotNet micro-benchmarks (Tests/MainframeEngine.Benchmarks/BenchmarkHost.cs) and cannot see frames. - Editor. Link protocol v3 carries Hello, Log, Status, Tree and Welcome
(
MainframeEngine/Src/EditorLink/EditorLinkProtocol.cs:8-41,:134). Status reports only FPS (:82), every 0.5 s (Project/GameSession.cs:17). The bottom dock holds only Output (MainframeEngine.Editor/Src/Layout/EditorLayout.cs:104).
ProfilerMarker+ProfilerScope: nested CPU scopes on any thread, 0 bytes when recording, about one static load and a branch when off, compiled out with anAppContextswitch.GpuProfiler: named GPU zones from one shared timestamp pool, keyed by frame slot and read back without ever waiting. The four existing pools move onto it.- Built-in markers on every frame phase and render stage (shadows, offscreen, prepass, main, each post effect, tonemap,
overlay), plus
VK_EXT_debug_utilslabels with the same names when the extension is present. - Counters: draw calls, triangles, instances, managed allocations per frame, GC collections and pause time, GPU memory, uploads, physics bodies, UI draws; games add their own.
- A history ring (default 600 frames), spike capture and freeze; a Profiler section in the F12 overlay.
- Export to the Chrome Trace Event JSON format, which Perfetto and
chrome://tracingopen.--profile-tracewrites one from the command line. - An editor Profiler tab fed over the editor link: frame graph, timeline (Main, other threads, GPU), scope table, counters, save and open traces.
ForestBenchmark, the render-test host andjust benchuse the profiler instead of their own timers.
Non-goals
Section titled “Non-goals”- Sampling profiling of managed code.
dotnet-trace, Instruments and Superluminal do it better; the profiler covers instrumented engine and game scopes. - GPU pipeline statistics or hardware counters (
VK_KHR_performance_query). Those are a vendor-tool job (RenderDoc, Xcode, Nsight). - Per-draw GPU timing (zones are pass and effect sized), memory profiling beyond counters (heap snapshots, allocation call stacks), the audio mixer’s inner graph (one “Mix” scope per callback), a network profiler.
Design
Section titled “Design”Code layout
Section titled “Code layout”| File (new unless noted) | Contents |
|---|---|
Src/Debugging/Profiling/: Profiler.cs, ProfilerMarker.cs, ProfilerScope.cs, ProfilerCounter.cs | the static recorder (frames, history, counters, spikes) and the public recording API |
Profiling/ProfilerThreadBuffer.cs, ProfilerFrame.cs, ProfilerSnapshot.cs | per-thread rings; frame records and read access for the UI, link and export |
Profiling/ChromeTraceWriter.cs, EngineMarkers.cs | trace JSON (Utf8JsonWriter); the engine’s built-in CPU and GPU markers |
Src/Rendering/Vulkan/GpuProfiler.cs | query pool, zones, read-back, debug labels |
Src/Debugging/DevOverlay/DevOverlayProfiler.cs | the overlay section and its snapshot |
Src/EditorLink/EditorLinkProtocol.cs (changed) | ProfileMarkers, ProfileFrame, profiler commands |
MainframeEngine.Editor/Src/UI/ProfilerPanel.cs, Content/Editor/profiler.rml | the editor tab |
Profiler is process-wide and static, like Log and Tr, so physics, audio, loaders and game code can record without a
tree. Profiler text is developer-facing English, like the rest of the dev overlay; it does not go through Tr.
CPU scopes
Section titled “CPU scopes”public enum ProfilerCategory : byte { Engine, Script, Physics, Render, Ui, Audio, Loading, Network, Game }
/// <summary>A named scope. Create once (static readonly); creation registers the name and may allocate.</summary>public readonly struct ProfilerMarker{ public ProfilerMarker(string name, ProfilerCategory category = ProfilerCategory.Game, [CallerFilePath] string file = "", [CallerLineNumber] int line = 0); public ushort Id { get; } public string Name { get; } public ProfilerScope Auto(); // using var _ = Marker.Auto(); public void Begin(); // for code that cannot use a using block public void End();}
public ref struct ProfilerScope { public void Dispose(); } // ends the scope; a no-op for one begun while off
public static class Profiler{ public static readonly bool IsAvailable; // false with AppContext "MainframeEngine.Profiler.Disabled" public static bool IsRecording { get; } // IsAvailable && (Acquire count > 0) && !Paused public static bool Paused { get; set; } // freeze: history stops changing, the UI can inspect it public static int Acquire(); // a consumer starts recording; returns a token public static void Release(int token);
public static ProfilerScope Scope(string literalName); // convenience: interned by reference, registered on first use public static void SetThreadName(string name); // names this thread's lane ("Loader", "Audio")
public static float SpikeThresholdMs { get; set; } // 0 = off public static bool FreezeOnSpike { get; set; } public static event Action<long>? SpikeCaptured; // frame number; raised on the main thread
public static ProfilerSnapshot Snapshot { get; } // read access to history, spikes, markers (main thread) public static Task SaveTraceAsync(string path, int lastFrames = 0); // 0 = the whole history}private static readonly ProfilerMarker Think = new("Enemy.Think", ProfilerCategory.Script); // in a nodeprotected override void OnPhysicsProcess(float delta) { using var _ = Think.Auto(); /* ... */ }- Event.
struct ProfilerEvent { long Start, End; ushort Marker; byte Depth, Thread; int AllocatedBytes; }(24 bytes) withStopwatch.GetTimestamp()ticks.Auto()checksIsRecording, pushes the start onto the thread buffer’s depth stack and returns the buffer index;Disposewrites the end. The scope is aref struct, so it cannot be boxed or escape. - Off cost.
IsRecordingis one static field. With theAppContextswitch set,IsAvailableis a static readonlyfalseand tier-1 code drops the branch entirely.ProfilerBenchmarkschecks both (Testing). - Misuse. Ending scopes out of order, or a frame ending with scopes still open, closes them at the frame end and
counts
UnbalancedScopes(oneLog.Warnper marker). This never throws in a frame. - Allocation tracking. With
ProfilerOptions.TrackAllocations,Begin/Endalso readGC.GetAllocatedBytesForCurrentThread(), and the table’s Alloc column shows which scope allocated. Off by default, because it costs about twice a plain scope. - Threads. A thread’s buffer is created on its first scope while recording; that one-time allocation is outside any
gate window. Background buffers are single-producer rings that the main thread drains at the frame end, assigning
events to frames by timestamp. The loader thread (ADR 0183) and the audio thread’s callback get markers. The audio
thread is opt-in (
ProfilerOptions.AudioThread) because its callback must never wait. A full ring drops events and countsDroppedEvents.
Frames and history
Section titled “Frames and history”Engine calls Profiler.BeginFrame(frameNumber) at the start of OnUpdate and Profiler.EndFrame() after EndFrame
(both internal). HeadlessHost does the same around its Step. A ProfilerFrame (readonly struct) holds the frame
number, start ticks, CpuMs (Engine.LastFrameCpuMilliseconds), WaitMs (LastFrameWaitMilliseconds), GpuMs
(first to last timestamp; NaN until read back two frames later, or untimed), IsSpike, and spans over its CPU events,
GPU zone samples and counter values in the snapshot.
Storage is preallocated when recording first starts: a frame ring (HistoryFrames, default 600, 10 s at 60 Hz), a
main-thread event ring (EventCapacity, default 65 536 events, 1.5 MiB) shared by all frames, and a counter block
(MaxCounters 64 × 8 bytes per frame). When the event ring wraps, the oldest frames lose their events and keep their
totals. Spikes: when a frame’s CPU or GPU time exceeds SpikeThresholdMs, its events are copied into one of
SpikeSlots (default 8) preallocated slots, so the spike survives the ring wrapping. With FreezeOnSpike, Paused
becomes true after that frame’s GPU data arrives.
EngineOptions.Profiler (ProfilerOptions): RecordFromStart (--profile), GpuTimings (pass-level zones, default
on, see GPU zones), DetailedGpuZones (in-pass zones, default off), HistoryFrames, EventCapacity,
MaxGpuZones (128), SpikeSlots, TrackAllocations and AudioThread (both off).
GPU zones
Section titled “GPU zones”GpuProfiler is owned by VulkanRenderer and exposed as IVulkanContext.GpuProfiler, so code drawing in
OnRenderMainPass can add zones:
public sealed class GpuProfiler{ public bool IsSupported { get; } // timestampComputeAndGraphics, period > 0, valid bits > 0 public bool SamplesAtEncoderBoundaries { get; } // MoltenVK (VK_KHR_portability_subset present) public GpuZone Zone(CommandBuffer cb, in ProfilerMarker marker); // using var _ = gpu.Zone(cb, Markers.MyPass); public double LastMilliseconds(in ProfilerMarker marker); // the most recent read-back, 0 when untimed}public ref struct GpuZone { public void Dispose(); }- One pool.
MaxFramesInFlight × MaxGpuZones × 2timestamp queries (default 512). Slotsowns the range[s × 2 × MaxGpuZones, …). The timestamp mask comes from the graphics family’stimestampValidBits, asShadowSystem.CreateTimestampPoolcomputes it today (ShadowSystem.cs:160-185); that function moves here. - Lifecycle. In
BeginFrame, right after the slot’s fence wait (VulkanRenderer.cs:237), the slot’s previous zones are complete:vkGetQueryPoolResultswithoutWAITreads them into a preallocated array and hands them toProfilerfor framen − MaxFramesInFlight. ThenvkCmdResetQueryPoolfor the used range is recorded before_uploads.Record(cb), outside any render pass. Zones writeTopOfPipeat begin andBottomOfPipeat end, the pattern the four existing pools use. A zone pastMaxGpuZonesis dropped and counted. - Never stalls. No
WAIT_BIT, novkQueueWaitIdle. A frame skipped during swapchain recreation simply has no zones. - Debug labels. When
VK_EXT_debug_utilsis available, it is enabled even without validation (IsInstanceExtensionAvailable), and every zone also recordsvkCmdBeginDebugUtilsLabelEXT/Endwith its marker’s name and category colour. RenderDoc and Xcode captures then show the same names. Label strings are marshalled once per marker into unmanaged memory. - Built-in zones (pass-level, on when
GpuTimings):
| Zone | Where |
|---|---|
Uploads | around _uploads.Record(cb) (VulkanRenderer.cs:282) |
Shadows | RenderServer.RenderShadows (replaces the ShadowSystem pool) |
Offscreen, Picking | RenderServer.RenderOffscreen (sub-viewports, object-ID) |
Prepass | RenderServer.RenderPrepass; then one zone per AfterPrepass effect |
Main pass | BeginRenderPass → BeginOverlayPass (sky, visuals, OnRenderMainPass) |
UI offscreen | the overlay renderers’ RecordOffscreen loop (Presentation.cs:839) |
| one per post effect | PostProcessStack.Record, around effect.Record (PostProcessStack.cs:109), named PostEffect.Name |
Tonemap | the tonemap draw |
Overlay | the overlay pass; per-renderer zones only with DetailedGpuZones |
SsaoEffect, AutoExposure and VolumetricFogEffect lose their pools. Their LastGpuMilliseconds, the
RenderServer.*GpuMilliseconds properties and ShadowSystem.LastGpuMilliseconds stay as read-throughs to
GpuProfiler.LastMilliseconds, so the dev overlay’s Shadows panel and ForestBenchmark keep working unchanged.
- MoltenVK. Apple GPUs sample timestamps at encoder boundaries (color-pipeline.md:396).
Zones that bracket whole render passes or compute/blit encoders measure correctly. Zones inside one render pass
collapse onto the pass’s boundaries. Pass-level zones are therefore the default, and where
SamplesAtEncoderBoundariesis set the UI shows in-pass zones with ”≈” and a tooltip saying why. Whether extra timestamp writes split encoders on MoltenVK is measured in G10.2 (Open questions). - lavapipe. Timestamps exist but measure a CPU rasterizer, so tests assert structure, never durations.
- Timeline alignment. To place the GPU lane under the CPU lanes,
VK_KHR_calibrated_timestamps/VK_EXT_calibrated_timestampsis used when present (a CPU/GPU pair sampled once per second). Otherwise each frame’s first GPU timestamp is aligned to that frame’s submit time and the lane is labelled “aligned to submit”.
Built-in CPU markers
Section titled “Built-in CPU markers”EngineMarkers (internal) puts scopes on the frame: Frame, Update, OnUpdate, Tree.Tick, Scene load
(AdvanceSceneLoads), Physics step (each RunPhysicsStep), PhysicsServer3D/2D.FixedStep, Process, Deferred,
Transform sync, one per frame server (UiServer, DevOverlay, AudioServer, …, named by type once at
registration), Render, PrepareFrame, BeginFrame (with Wait (fence) and Acquire inside), Shadows,
Offscreen, Prepass, Main pass, Overlay, Submit, Present. SceneTree.ProcessSeconds and
PhysicsProcessSeconds stay as they are. ShadowSystem.LastCpuMilliseconds becomes a read-through to the Shadows
scope. Node callbacks are not wrapped one by one: that would cost a scope per node per frame. Games mark their own hot
paths.
Counters
Section titled “Counters”Games declare static readonly ProfilerCounter Enemies = new("Enemies", ProfilerCounterUnit.Count); and call
Set(long) or Add(long) (units Count, Bytes, Milliseconds, Percent).
Counters are per-frame long slots, reset to the last value (Set) or to 0 (Add) at each BeginFrame. Built-ins,
sampled at EndFrame: draw calls, prepass/shadow/ID draws, instances and culled (MeshDrawStats), triangles (a new
MeshDrawStats.Triangles: index count / 3 × instances, summed where DrawCalls++ happens), canvas and UI draws,
managed bytes allocated this frame on the main thread (GC.GetAllocatedBytesForCurrentThread delta), gen 0/1/2
collections (GC.CollectionCount), GC pause ms (GC.GetTotalPauseDuration delta), GPU memory used/reserved
(GpuAllocator.Totals), uploaded bytes (UploadQueue.TotalUploadedBytes delta), physics bodies awake/total, the
physics libraries’ allocated bytes, node count (SceneTree.NodeCount), audio voices. All of them are O(1) reads that
already exist, apart from triangles.
Dev overlay section
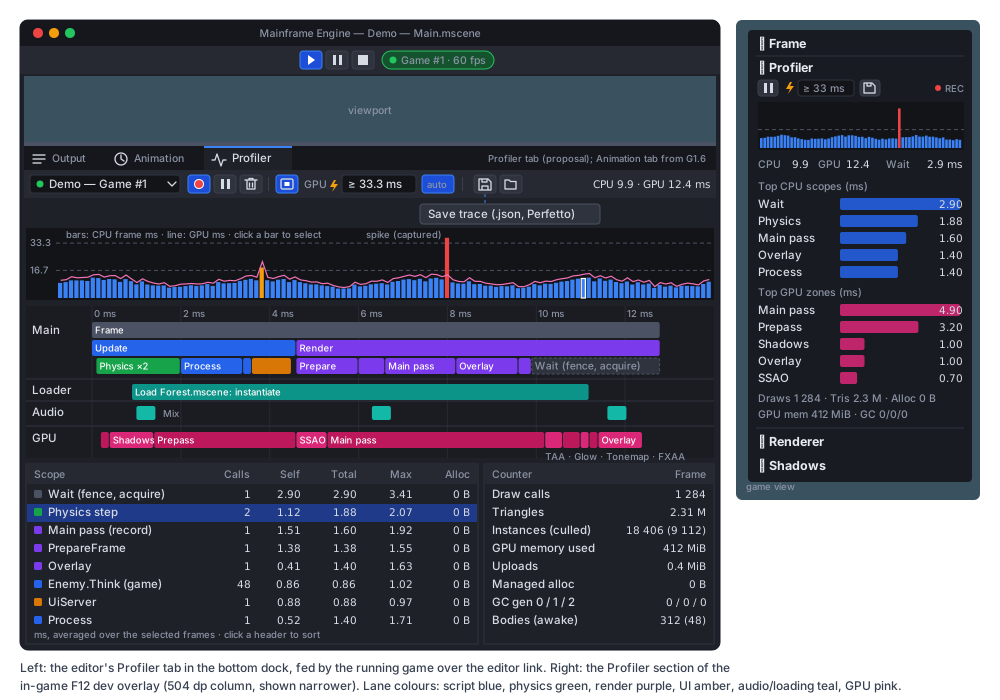
Section titled “Dev overlay section”DevOverlayPanels.AddBuiltIns adds a profiler panel between Frame and Renderer. It starts collapsed. Expanding it
calls Profiler.Acquire() and collapsing it releases the token (DevOverlayPanel gains an ExpandedChanged event),
so a visible overlay costs nothing extra until someone looks at the profiler. Contents (see the figure):
- Buttons: Pause, a spike threshold field with an “auto-freeze” toggle, and Save trace. Saving writes to
UserDataPaths.GetDirectory(game)/profiles/trace-<utc>.jsonand logs the path. - A frame graph of the last 60 frames as data-bound bars (
data-forover a reusedBindListof row objects;data-style-heightfrom afloat; classesoverandspikefrom the 16.7/33.3 ms budgets). This is the pattern the overlay already uses, so no new rendering code is needed. The alternative, a CPU-rasterised texture throughRegisterTexture, needs per-slot images to avoid overwriting an image an in-flight frame samples, and is not needed at 60 bars. - CPU, GPU and wait ms of the selected frame (the newest one, or the frozen one).
- The top 5 CPU scopes and the top 5 GPU zones by self time, averaged over the refresh window, as bars.
- A counters line.
Everything refreshes on DevOverlay.Refreshed (4 Hz), reading Profiler.Snapshot into the panel’s reused snapshot
object. Numbers are bound as float/int and names are the markers’ cached strings, so it does not allocate. In the
overlay, F12 stays the only key. A freeze key is an open question.
Trace export
Section titled “Trace export”ChromeTraceWriter writes Chrome’s Trace Event Format (JSON object form):
complete events ("ph":"X", ts/dur in µs) per scope; thread-name metadata ("ph":"M") for Main, Loader and Audio
in process 1; the GPU lane as process 2 ("GPU (aligned to submit)" or "GPU (calibrated)"); counters as "ph":"C";
a "Frame n" instant event at each frame start; spike frames tagged in args. Saving copies the history on the main
thread into a pooled buffer (an allocation at save time, which is not per-frame) and writes on a worker through
Utf8JsonWriter. ui.perfetto.dev and chrome://tracing open the result. Command line (GameHostOptions):
| Flag | Effect |
|---|---|
--profile | record from the first frame (ProfilerOptions.RecordFromStart) |
--profile-trace <file> | record, and write the trace on exit (or after --profile-frames n, then quit) |
--profile-frames <n> | how many loaded frames to keep in the trace (loading frames excluded, like --max-frames) |
HeadlessHost honours the same flags (CPU lanes only), which covers dedicated servers.
Editor Profiler tab
Section titled “Editor Profiler tab”The bottom dock gets the tab strip that G1.6 and G2a.3 propose (Output | Animation | … | Profiler). Whichever task
lands first adds the strip; the Profiler tab is permanent, with an activity icon. Layout as in the figure:
- Toolbar (icon buttons with tooltips,
theme.rcss): source picker (each running game instance, plus “Editor” to profile the editor process itself); Record (circle-dot; starts streaming); Pause (player-pause; freezes the view while the game keeps running); Clear (trash); GPU zones (cpu); spike threshold (bolt+ field) with auto-freeze; Save trace (device-floppy); Open trace (file; loads a.jsonwritten by this exporter); the selected frame’s CPU/GPU ms on the right. - Frame graph of every received frame (up to 3 600): CPU bars, GPU line, budgets; click selects a frame, drag a range.
- Timeline of the selection: Main / Loader / Audio / GPU lanes of nested bars coloured by category; wheel zooms, drag pans, hover shows name, duration and self time. Drawn like G1.6’s timeline, or from a reused element pool before it.
- Scope table (Calls, Self, Total, Max, Alloc; sortable; double-click opens the marker’s
[CallerFilePath]line through the Output panel’s source links) and counters for the selected frame.
ProfilerPanel keeps received frames in its own ring (array-backed and preallocated). Editor code keeps no game
objects, only wire data, so code reload (editor.md) is unaffected.
Editor link messages
Section titled “Editor link messages”Protocol Version goes from 3 to 4. New types and commands:
| Message | Direction | Payload |
|---|---|---|
ProfileMarkers = 8 | game → editor | u16 count, count × (u16 id, u8 category, u8 kind (cpu/gpu/counter), str name, str file, i32 line); sent for markers the editor has not seen yet |
ProfileFrame = 9 | game → editor | u64 frame, i64 startTicks, i64 tickFrequency, f32 cpuMs, f32 waitMs, f32 gpuMs, u8 flags (spike, truncated), u8 counters × (u16 id, i64 value), u16 threads × (u8 id, str name if new), u32 cpuEvents × (u16 marker, u8 thread, u8 depth, u32 startUs, u32 durUs, i32 alloc), u16 gpuZones × (u16 marker, u8 depth, u32 startUs, u32 durUs) |
ProfileDropped = 10 | game → editor | i64 frames dropped because the editor fell behind |
ProfilerStart = 7 | editor → game command | argument gpu=1;spike=33.3;freeze=0 |
ProfilerStop = 8 | editor → game command | — |
GameSession.Apply (Project/GameSession.cs:251-276) handles the commands: Start calls Profiler.Acquire() and
attaches a ProfilerStreamer, Stop releases it. Frames are sent once their GPU zones arrive (two frames late). The
main thread copies a finished frame into one of eight preallocated frame blocks. EditorLinkClient serialises blocks
on its own thread into a reused ArrayBufferWriter and returns them. When no block is free, the frame is dropped and
counted: the game never waits for the editor. A frame is about 12 bytes per event; 500 events at 60 fps is about
0.4 MB/s on localhost. Frames whose events exceed MaxFrameLength (1 MiB) are cut at a depth and flagged truncated.
An editor talking to a v3 game disables Record, with the tooltip “Game built with an older engine”.
Benchmarks and tools
Section titled “Benchmarks and tools”just bench: newProfilerBenchmarks:ScopeOff(switch off),ScopeIdle(available, not recording),ScopeRecording,ScopeRecordingWithAllocations,CounterAdd,EndFrame500Events,GpuZoneOffCpuSide. All 0 B, recorded inbaseline.json. These guard the “costs nothing when off” promise.ForestBenchmark: reads every GPU zone fromProfilerFrameinstead of the four properties. Its JSON gains p50/p99 per zone and per top CPU scope, and--trace <file>writes the flight as a trace.just forest-benchforwards it. The baseline comparison (p50/p99 frame time) is unchanged.- Render-test host:
HostResultgainsGpuZones(average ms per zone over the--perfwindow) and the top CPU scopes. They are logged and not gated, because timings are machine-dependent. - QA scripts: a
profile save <file>step for.qascripts, so a QA run can attach a trace to its artifacts.
External profilers (Tracy and others)
Section titled “External profilers (Tracy and others)”The built-in recorder needs no new dependency. Forwarding to an external tool is optional and needs a dependency decision (Open questions):
| Option | What it gives | Cost |
|---|---|---|
| A. None (this proposal’s baseline) | overlay, editor tab, Perfetto traces | nothing new |
B. Tracy through an in-house native shim (Native/Tracy, mftracy, built per RID by natives.yml like mfrmlui; BSD-3) | live nanosecond timeline, Tracy’s statistics, frame images, memory views; our measured GPU times forwarded through Tracy’s manual GPU-zone C API | a native build per platform, static linking on iOS, client and GUI protocol versions must match (pin both) |
| C. A community C# Tracy binding from NuGet | as B without our own native build | maintenance and AOT/trimming unverified; one more package |
D. .NET built-ins: an EventSource mirroring markers, System.Diagnostics.Metrics for counters | dotnet-trace/PerfView/dotnet-counters see engine scopes next to GC and JIT events | no package; the tools are less suited to frame views |
Any of B–D plugs in as an internal IProfilerSink that Profiler.EndFrame feeds from the same frame records, so
recording code does not change.
Testing
Section titled “Testing”- Unit (
Tests/MainframeEngine.Tests/Profiling/, collectionSerialProfiler:Profileris process-wide): nesting and depth withBegin/EndandAutomixed; unbalanced scopes closed and counted; off records nothing; theAppContextswitch (child process) makesIsAvailablefalse;Acquire/Releasecounting;Pausedfreezes history; ring wrap (totals kept, events lost) andDroppedEvents; background events assigned to frames by timestamp; counter reset rules and built-ins against fakes; spikes survive a wrap andFreezeOnSpikewaits for GPU data;ChromeTraceWritergolden JSON with an injected clock, parsed back withJsonDocument;MeshDrawStats.Trianglesfor indexed, instanced and MultiMesh draws. - Allocation gates:
ProfilerAllocationTestsrecords 300 frames of 500 scopes on two threads, 32 counters, spike captures and the overlay snapshot refresh at 0 bytes (AllocationGate.SmallestWindow). The render tests’showcasegate gets a second run with--profileand the overlay’s Profiler section expanded. Thegamehostgate adds a run streaming to a loopbackEditorLinkServer. - GPU (render tests, both drivers):
ProfilerGpuZoneTestson the showcase scene checks that the expected zone names appear in frame order, durations are ≥ 0, zones nest inside the frame, the read-back arrives exactlyMaxFramesInFlightframes later, and nothing waits (LastFrameWaitMillisecondsmatches a run with the profiler off, within noise). The validation gate covers query resets outside render passes and debug labels. No new goldens: the profiler draws nothing unless the overlay shows it, and its numbers are not deterministic. The existing goldens must not change. - Protocol:
EditorLinkProtocolround trips forProfileMarkers,ProfileFrame(with truncation atMaxFrameLength),ProfileDroppedand the commands; a v4 editor with a v3 game; a slow reader drops frames and the game’s frame time is unchanged. - UI (
SerialRmlUi): the overlay section binds, expanding acquires and collapsing releases, bars update, Save writes under a temporaryMAINFRAME_USER_DATA. Editor:ProfilerPanelwith a fake link (frames, selection, table statistics, pause, save and reopen a trace). Benchmarks:ProfilerBenchmarks(above). - QA:
Tests/QA/editor-walkthrough.qaplays the Demo, opens the Profiler tab, records 2 s, selects the slowest frame and screenshots the tab.forest-benchruns once with--traceand checks that the file parses.
Acceptance
Section titled “Acceptance”- With the profiler off,
ProfilerBenchmarks.ScopeIdlecosts ≤ 1 ns andScopeOff0 ns over the empty baseline, and every gate stays at 0 B with scopes on all engine paths. - Recording the Forest at 1920 × 1080 adds < 0.1 ms CPU per frame and shows CPU scopes, GPU zones for every pass and post effect, and counters, in the overlay and in the editor, with no extra GPU wait.
- The four ad-hoc timestamp pools are gone. The Shadows panel,
RenderServer.*GpuMillisecondsandForestBenchmarkreport the same numbers as before (within run-to-run noise). - A 33 ms hitch is captured, survives 10 s of further frames and can be inspected frozen.
--profile-traceoutput opens in Perfetto with Main, Loader, GPU and counter tracks; RenderDoc shows the passes by name. - Streaming to the editor does not change the game’s frame time beyond noise; a busy editor costs dropped frames only.
just build,just test,just test-render(both drivers),just format-checkandjust benchpass.- Docs updated when it ships: new
docs/design/profiler.md;dev-overlay.md,editor.md(tab, link v4),project-and-gamehost.md(flags, options),post-processing.mdandshadow-system.md(zones replace the pools),gpu-resources.md,vulkan-renderer.md(labels),testing.md,forest.md, andCLAUDE.md(Debugging/Profiling/).
Task list
Section titled “Task list”- G10.1 CPU recorder.
Profiler,ProfilerMarker,ProfilerScope, thread buffers, frame and history rings,ProfilerOptions/EngineOptions.Profiler, theAppContextswitch,Engine/HeadlessHostframe boundaries,EngineMarkerson the frame; unit tests,ProfilerAllocationTests,ProfilerBenchmarks+baseline.json. - G10.2 GPU zones.
GpuProfiler(one pool, slot ranges, mask, read-back after the fence), built-in zones inVulkanRenderer,PostProcessStackandRenderServer; the shadow, SSAO, auto exposure and fog pools replaced by read-throughs; debug-utils labels; MoltenVK granularity flag and calibration; render-test zone checks, validation gate; measure the MoltenVK encoder cost. - G10.3 Counters and spikes.
ProfilerCounter, built-in counters,MeshDrawStats.Triangles, GC and allocation counters, per-scope allocation tracking, spike slots and freeze, loader/audio thread markers; tests. - G10.4 Overlay and export. The overlay’s Profiler section (
DevOverlayPanel.ExpandedChanged, graph bars, top scopes, counters, Save),ChromeTraceWriter,--profile/--profile-trace/--profile-frames, QAprofile save; UI tests, the secondshowcaseallocation gate;dev-overlay.md. - G10.5 Editor link. Protocol v4 messages and commands,
ProfilerStreamer+ frame blocks, client serialisation and dropping,GameSessionhandling; protocol tests and thegamehoststreaming gate. - G10.6 Editor Profiler tab. Bottom dock tab strip (if G1.6/G2a.3 have not added it),
profiler.rml,ProfilerPanel(graph, timeline, table, counters, source picker including “Editor”, save/open trace); editor tests, QA walkthrough step;editor.md. - G10.7 Tools.
ForestBenchmarkon profiler frames with--traceand per-zone JSON,HostResult.GpuZones, docs (forest.md,testing.md, newprofiler.md,CLAUDE.md). - G10.8 External sink (only after the dependency decision):
IProfilerSinkand the chosen backend (Tracy shim, binding, orEventSource/Metrics).
Open questions
Section titled “Open questions”- External profiler dependency. Ship none (A), a Tracy native shim (B), a NuGet binding (C) or the .NET built-ins
(D)? Default: A now, and D later if a cheap bridge to
dotnet-traceis wanted. B needs anatives.ymljob and pinned Tracy versions. - Always-on pass timing. Today four passes are always timed. Should all pass-level zones be on by default
(
GpuTimings = true, about 40 timestamps per frame) or only while recording? This depends on the measured cost on MoltenVK, where a timestamp outside a pass may end the current blit/compute encoder. - Calibrated timestamps. Do MoltenVK and lavapipe expose
VK_KHR/EXT_calibrated_timestamps? If not, is submit alignment good enough for the GPU lane, or should the GPU lane be drawn on its own time axis? - Profiler in exported games. Should G5 export presets set the
AppContextswitch (scopes compiled out) by default, or keep the profiler so players’ traces can be attached to bug reports? This interacts with whether F12 is available in shipped builds. - Freeze key. Is a key needed in games (F12 is the overlay, F8 the RmlUi debugger; F5–F9 are taken in the editor),
or are the button and
FreezeOnSpikeenough? - Timeline rendering in the editor. Reuse G1.6’s timeline canvas (a dependency on G1 ordering) or ship a DOM pool first and switch later?
- Node-level attribution. Should an opt-in mode wrap every
OnProcess/OnPhysicsProcesscall in a per-type scope (Godot’s script profiler) at a measurable cost, or should games add markers themselves?
Related
Section titled “Related”- Dev overlay, Editor, Project and GameHost, Testing, Engine lifecycle, Vulkan renderer, GPU resources, Post-processing, Shadow system, Color pipeline (MoltenVK note), Forest, Natives (Tracy)
- Rendering backend abstraction (M11 moves
GpuProfilerbehindIGpuDevice); siblings Keyframe animation (G1.6 tabs), 2D content (G2a.3), Game export (G5: the profiler switch per preset)